


If you want to be successful at forex trading, you have to understand candlestick charts. These charts tell a strong story about how prices change over time. They help traders understand market trends, momentum, and possible turns around. So how do you read charts when you trade forex? For those of you who have ever felt like those tiny bars on your screen were too much, don't worry! This guide will show you how to do everything step by step.
What Are Candlesticks in Forex Trading
Candlesticks are graphical representations of price movements within a specified time frame in the forex market. Each candlestick consists of four key parts: the opening price, the closing price, the highest price, and the lowest price during a given period. Together, these components form the candlestick body and its wicks (or shadows). These charts were first developed in Japan during the 18th century and have since become a and have since become a staple tool in modern trading.
Understanding Candlestick Components
The Body of the Candlestick
The body of a candlestick represents the difference between the opening and closing prices.
- A long body signals strong buying or selling pressure.
- A short body means little price movement or indecision in the market.
The Wick (Shadow) of the Candlestick
The wick, also called the shadow, shows the highest and lowest prices during a trading session.
- If the top wick is long, it means that buyers tried to take control of the market by driving prices up at first. Even though buyers tried, sellers finally took back control and pushed the price back down until it closed lower than the high point.
- A long lower wick shows that buyers took over at first and pushed prices down a lot. But buyers jumped in and drove prices back up, despite their efforts. This showed that there was strong buying pressure and an attempt to take back control of the market.
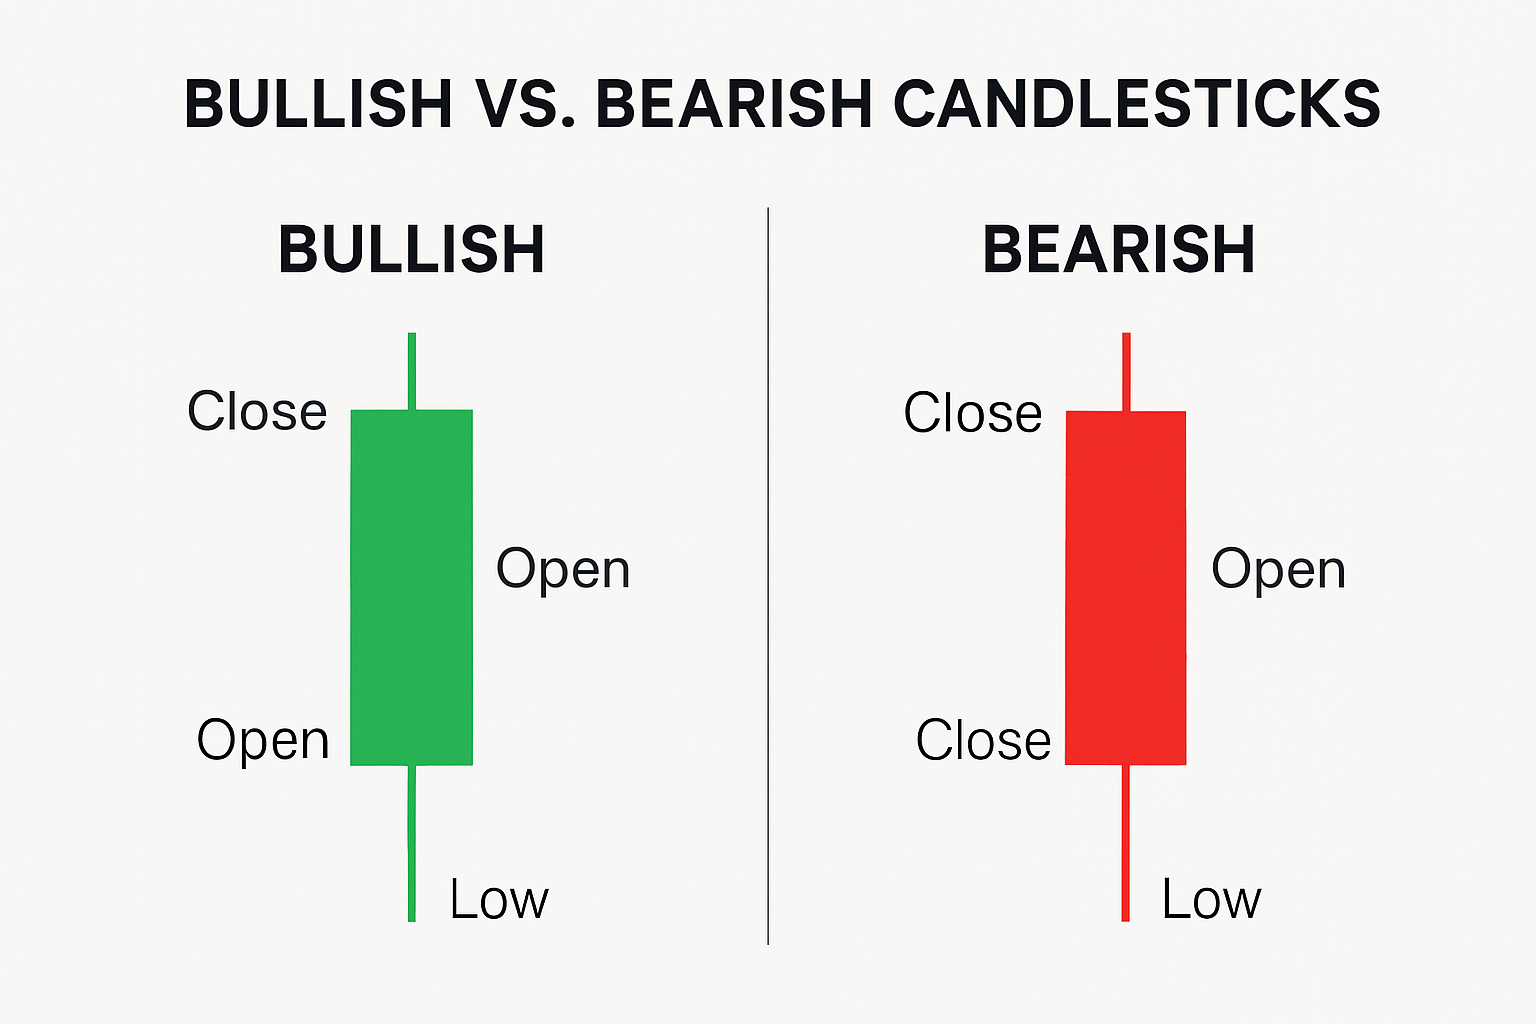
Bullish vs. Bearish Candlesticks
- - A bullish candlestick represents upward market movement. The body of the candlestick is colored green or white (depending on the chart's color scheme), and it shows that the closing price is higher than the opening price, indicating that buyers dominated the market during that time period. This pattern signals optimism and potential price increases.
- - A bearish candlestick, typically shown in red or black, indicates that the closing price is lower than the opening price. This suggests that sellers were in control during that period, driving the price down. The longer the body of the candlestick, the stronger the bearish sentiment.
Common Candlestick Patterns Every Trader Should Know
Doji
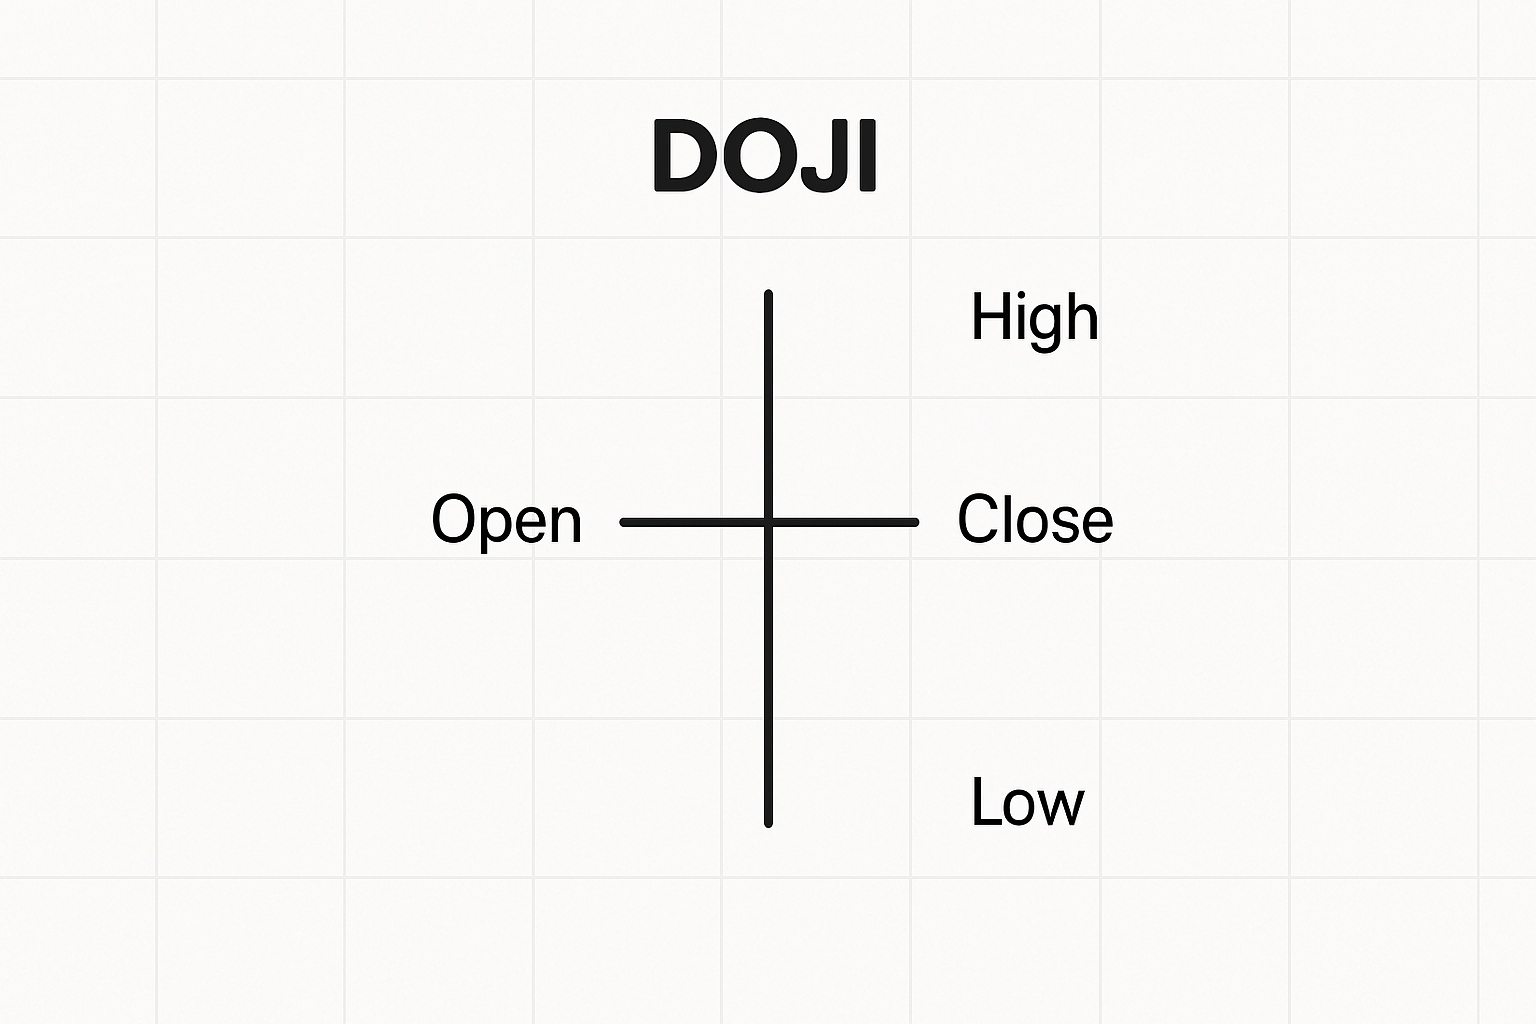
When the starting and closing prices are almost the same, a Doji candlestick shows up. It has a small body with long upper and lower shadows. This pattern shows that the market is stuck, with neither buyers nor sellers taking charge. This can often mean that the direction will change. The formation of a Doji can be seen as a sign that the current trend may be losing steam and that the market may be about to change direction.
Before taking action, traders need to make sure the reversal is real by looking at the surrounding price action and other signs.
Hammer and Inverted Hammer
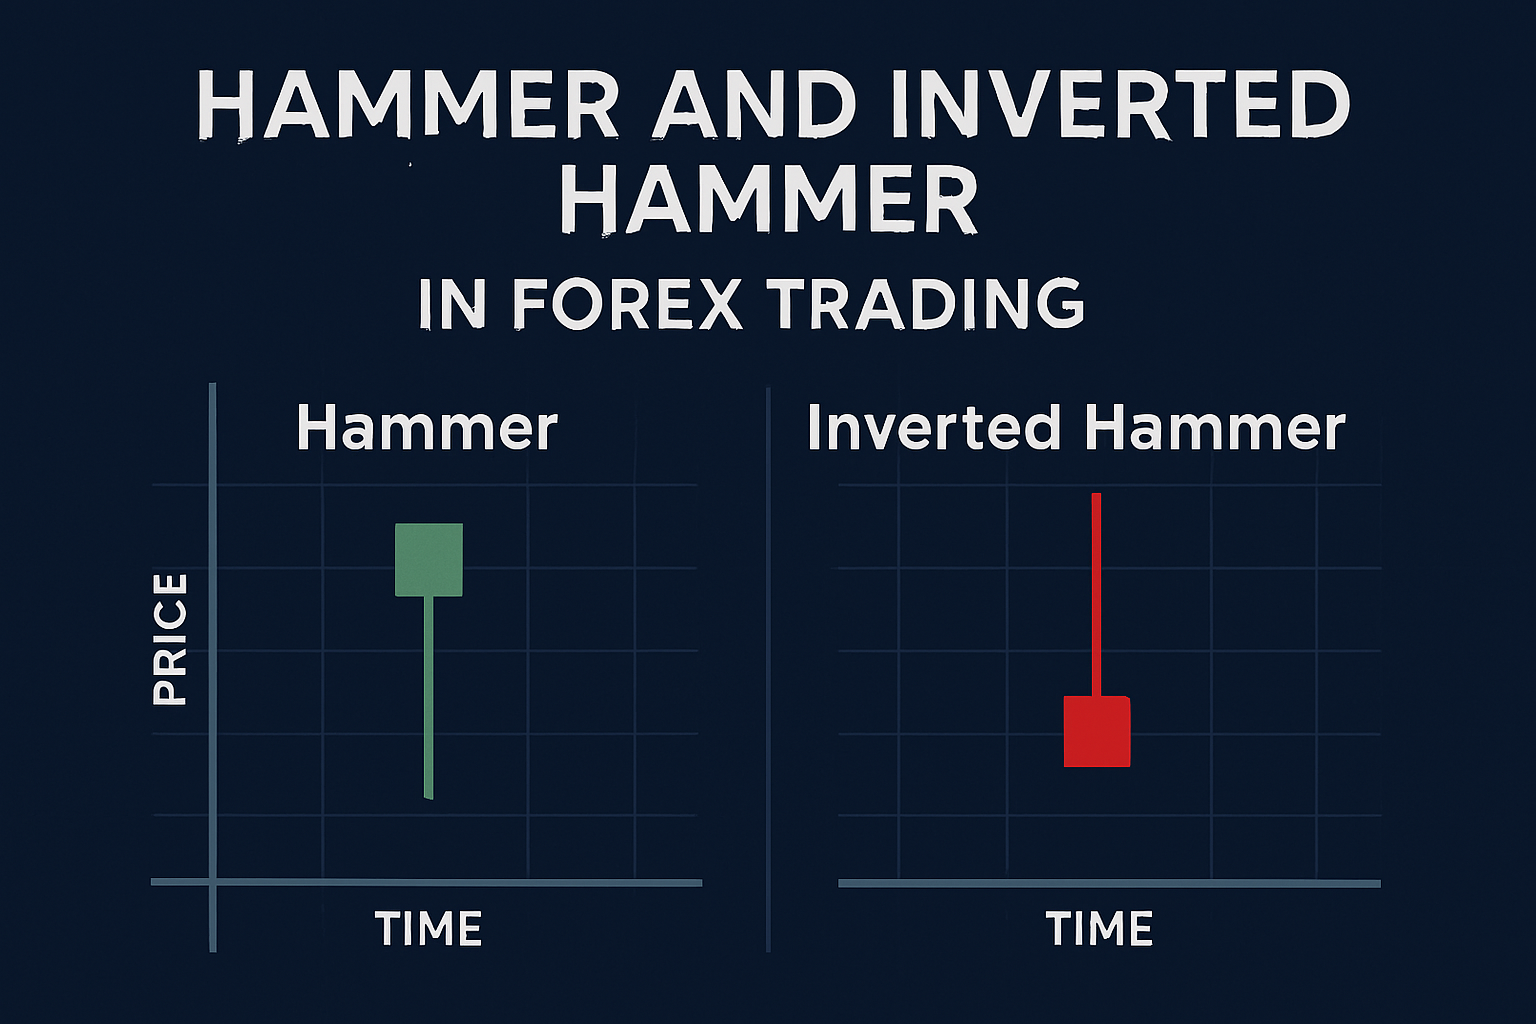
1. A Hammer candlestick pattern has a small body and a long lower shadow. This shows that sellers pushed prices down at first, but buyers eventually took back control and drove prices back up. This pattern often means that there is a chance of a bullish turnaround, which means that the market's mood could soon change from bearish to bullish. The long lower wave shows that there was strong buying interest even though there was downward pressure. This could mean that the price will continue to rise. To be sure that this turnaround is real, traders often wait for bullish price action to follow.
ALSO READ: Top 10 Best Forex Brokers in Nigeria (2025)
2. An Inverted Hammer is a type of candlestick pattern that looks a lot like a hammer but shows up after a decline. This means that even though the price has been going down, there is a change in pace as buyers get stronger. This pattern shows that the falling trend might be changing or slowing down, which could mean that bulls are starting to take control. Buyers pushed the price up during the session, as shown by the long upper shadow of the Inverted Hammer.
However, the price was still close to the starting price at the end of the day, which indicates that sellers still had some control. But the pattern's general shape and setting point to a possible turning point, where more buying pressure could cause the trend to change.
Shooting Star
A Shooting Star is a type of candlestick design that has a small body and an upper wick that is long. This pattern usually appears after an increase. It means that even though the price hit a high point during the trading session, it was strongly rejected at that level. The long upper wick shows that buyers pushed the price up at first, but sellers finally took over and pushed it back down.
So, the Shooting Star points to a possible bearish reversal, which means that the upward trend may be losing strength and a falling trend may follow. People think this pattern is more important when it shows up after a long period of going up because it shows a change in how the market feels.
Double Candlestick Patterns
- A Bullish Engulfing pattern occurs when a small bearish candle is followed by a larger bullish candle, signaling a strong uptrend.
- A Bearish Engulfing pattern is the opposite—a small bullish candle followed by a larger bearish one, indicating a downtrend.
- Tweezer Tops: form when two consecutive candles have almost identical high points, signaling a bearish reversal.
- Tweezer Bottoms happen when two candles have matching lows, hinting at a bullish reversal.
How to Interpret Candlestick Patterns in Forex Trading
Recognizing patterns isn’t enough; you need to place them in context. If a bullish pattern appears in an uptrend, it reinforces the trend. If it shows up in a downtrend, it might signal a reversal.
Using Candlestick Patterns with Other Indicators
To increase accuracy, combine candlestick patterns with;
- Moving Averages – Confirm trend direction.
- RSI (Relative Strength Index) – Identify overbought or oversold conditions.
- Bollinger Bands – Spot volatility and potential breakouts.
Common Mistakes Traders Make When Reading Candlesticks
- Ignoring the overall trend – A bullish pattern in a strong downtrend might not mean a reversal.
- Forgetting confirmation – Always wait for additional signals before acting.
- Trading based on a single candle – Look at multiple timeframes for better accuracy.
Candlestick charts are an essential tool in forex trading, providing insights into price movements, trend reversals, and market sentiment. By mastering these patterns, traders can make smarter, more confident trading decisions. However, always remember to combine candlestick analysis with other technical indicators for the best results. Happy trading!
FAQs
1. What is the best candlestick pattern for forex trading?
There’s no single best pattern, but engulfing patterns, Doji, and Morning/Evening Stars are among the most reliable.
2. How do I confirm a candlestick pattern’s validity?
Use indicators like moving averages, RSI, and volume analysis to confirm patterns before making a trade.
3. Can I rely only on candlestick patterns for trading?
Not entirely. Candlesticks provide great insights, but combining them with support/resistance levels and trend analysis improves accuracy.
4. How long does it take to master reading candlesticks?
It depends on practice. With consistent study and back testing, most traders grasp the basics in a few months.
5. Do candlestick patterns work in all timeframes?
Yes, but their reliability increases in higher timeframes (e.g., 1-hour, 4-hour, or daily charts).


